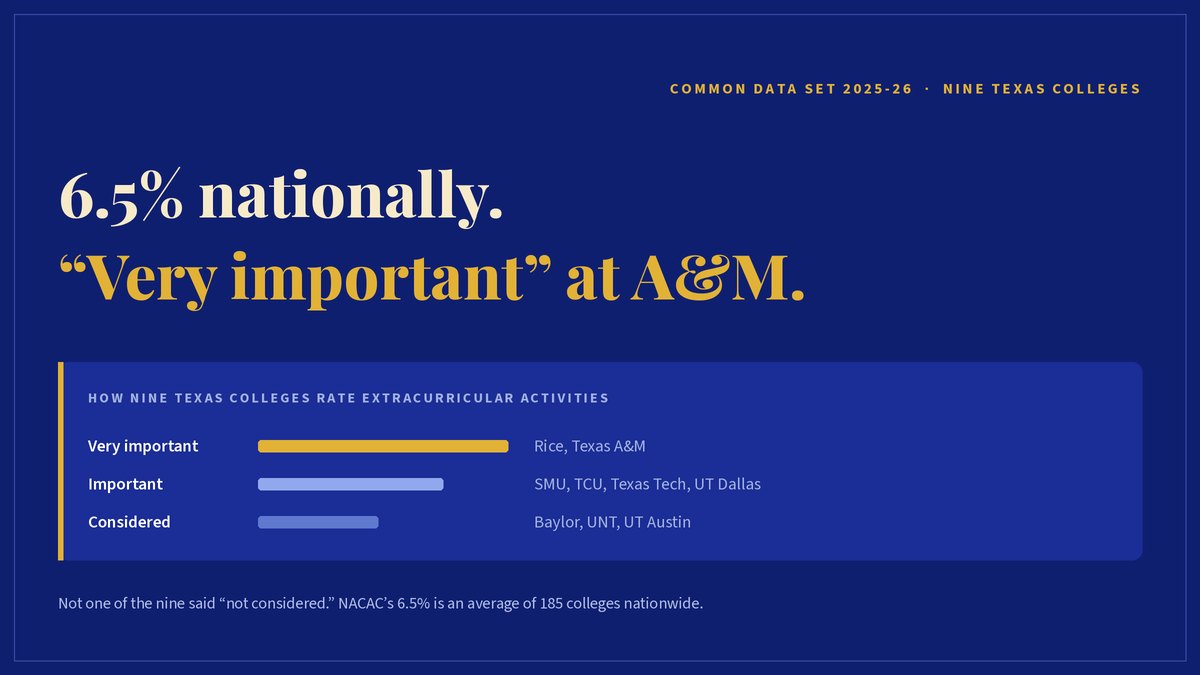
💡 TL;DR: The statistic families quote — that only 6.5% of colleges rate extracurriculars as having "considerable importance" — is a national average across 185 colleges of every selectivity level. We pulled the Common Data Set for nine Texas colleges North Texas families actually apply to and the picture inverts: six of the nine rate extracurricular activities important or very important, and not one of them marks the category "not considered." Applications are open. What your student did is already fixed. How it gets described is not.
The number everyone quotes
Every February we get the same question, and this year it arrived with a statistic attached: "I read that extracurriculars only matter to 6.5% of colleges."
That number is real. It comes from the National Association for College Admission Counseling, whose State of College Admission survey asks colleges to rate each admission factor as having considerable, moderate, limited, or no importance. In the Fall 2023 survey of 185 four-year colleges, the factors rated "considerable importance" most often were:
- Grades in college-prep courses — 76.8%
- All high school grades — 74.1%
- Strength of curriculum — 63.8%
- Extracurricular activities — 6.5%
Three years later, that is still the most recent NACAC survey of admission factors. Nothing newer has been published. So the number is not stale — but it is being read wrong, and the way it is being read is costing students.
Why that is the wrong number for your list
NACAC surveyed 185 colleges. Most four-year colleges in the United States admit most of the students who apply. A national average is therefore dominated by institutions that are, quite reasonably, making decisions on transcripts alone. That average tells you almost nothing about the specific colleges on your student's list.
There is a better source, and it is one families can check themselves. Every college publishes a Common Data Set — a standardized form the institution fills out about itself. Section C7 asks the college to rate each academic and nonacademic factor as very important, important, considered, or not considered. It is the college's own answer, in the college's own words, updated every year.
We pulled Section C7 from the 2025-26 Common Data Set for nine Texas colleges. Here is what they say about extracurricular activities:
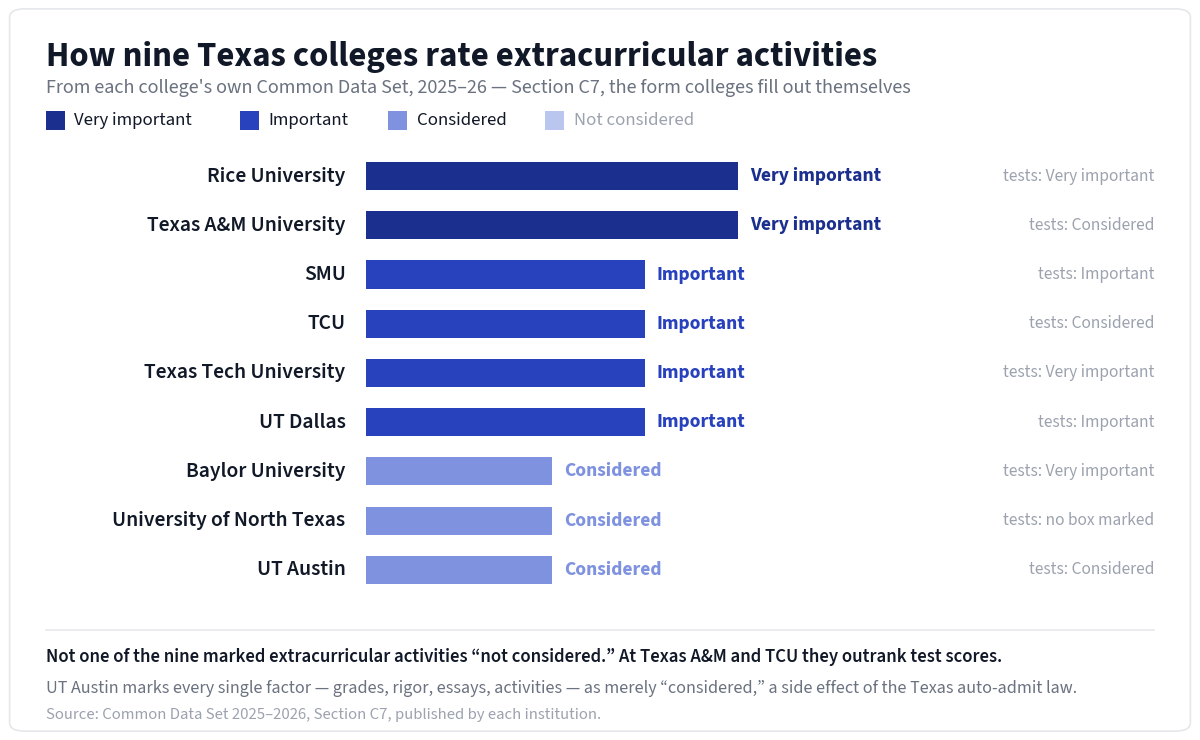
Two things stand out.
First, Texas A&M puts extracurricular activities in the same box as academic GPA, class rank, and rigor of curriculum: very important. In that same form, Texas A&M rates standardized test scores as merely "considered." At TCU, extracurriculars outrank test scores too. Whatever the national average says, these are not colleges treating activities as a rounding error.
Second, look at the bottom of the chart. UT Austin marks every single factor — grades, rigor, essays, recommendations, activities — as "considered," and nothing higher. That is not indifference. It is what happens when state law automatically admits most of your in-state class by class rank. For the students who are not auto-admitted, the review is holistic and the essays and activities carry real weight. The form simply cannot express that.
The honest summary: at the selective end, activities matter a great deal; at the open-access end, they matter little; and the single national average sits in between, describing neither.
What changed since we wrote about this in February
We published a version of this argument in February. Two things have moved since then, and one of them makes part of that earlier post out of date.
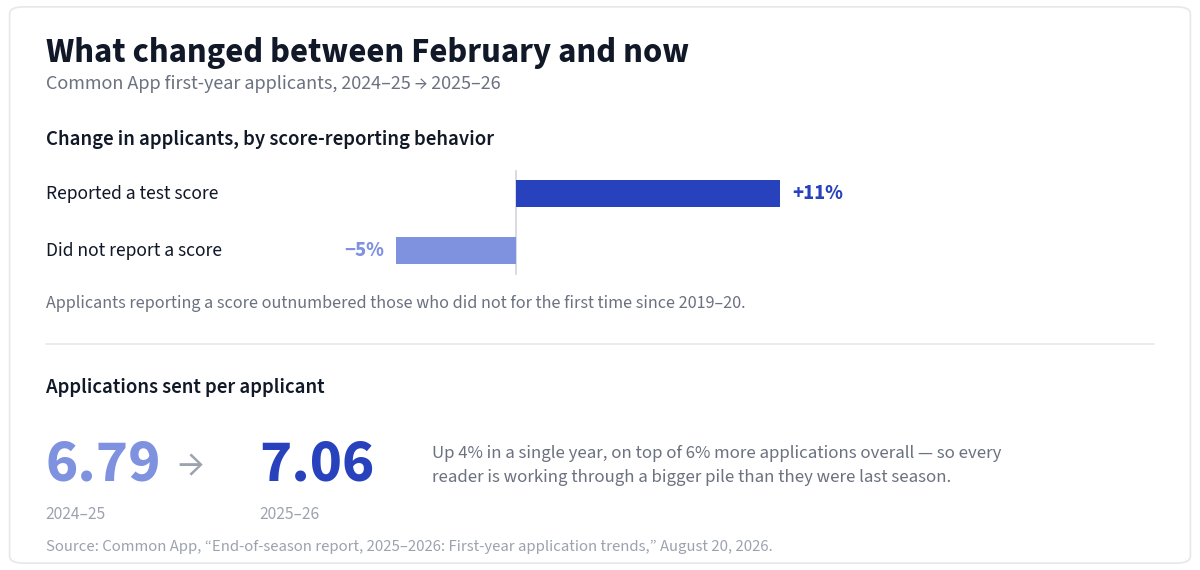
In February we pointed to a decade-long collapse in the importance of standardized tests. That trend has turned. In Common App's end-of-season report, published August 20, 2026, the number of applicants reporting a test score grew 11% while the number applying without one fell 5%. Score reporters outnumbered non-reporters for the first time since 2019-20. Only 5% of Common App members actually require a score — but students are sending them anyway, and a growing list of selective colleges has moved back to requiring them.
The second shift is volume. In 2025-26, 1,527,328 students sent 10,786,782 applications — 6% more than the year before — and the average student applied to 7.06 colleges, up from 6.79. Growth was fastest in the Southwest, at 9%, driven by Texas at 9%. More applications per student, read in the same number of weeks, means less time per file.
Those two facts point the same direction. When more applicants submit a test score, scores stop separating anyone. When every reader has a bigger pile, the application that survives is the one that is quick to understand. That is a job the activities list does or fails to do in about forty seconds.
Common App just renamed the section
On July 31, 2026, Common App announced the change in one sentence: "The activities section of My Common Application will be renamed activities and experiences, with fields that better capture a breadth of commitments beyond high school."
That is not cosmetic. It is the platform saying out loud that the twelve-club student is not the target.
Common App has also, for several cycles, let students report responsibilities and circumstances in this section, and its guidance to students is unusually direct about what counts: supervising a younger sibling, regularly assisting a grandparent, routinely handling cooking and cleaning and errands, working to provide family income. In Common App's words, these are "different from chores in that you are meeting an important need for your family as opposed to simply lending a hand."
Every year we meet a student who spent fifteen hours a week running the front of their parents' restaurant and left it off the application because it was not a club. That was always a mistake. It is now a mistake the form is actively trying to prevent.
How many activities should actually be on the list
The best evidence here is not a blog post. In the American Educational Research Journal, Park and colleagues analyzed the activity descriptions in more than six million Common App applications using natural language processing. They found that wealthier, private-school, white and Asian American applicants reported more activities and more top-level leadership titles than their peers — and that the ten-slot list rewards access as much as it rewards effort.
One of the research team's recommendations was to cut the list from ten slots to four or five.
No college is going to do that for you. But you can do it for yourself, and the reason to is the finding underneath the recommendation: a long list is not read as commitment. It is read as availability.
What to do this week
If you are a senior
The activities are done. The list is not. Pick the four to six entries that would still be true if nobody were watching, put them first, and spend your remaining time on the 150-character descriptions rather than on adding entries eight, nine, and ten. If an entry exists only because the slot was empty, delete it — a shorter list that is entirely load-bearing reads as confidence. We wrote a full guide to the descriptions themselves in how to write the Common App activity list.
Then check your list against your essays and your recommenders. The single most common failure we see is not a weak activity. It is four documents that describe four different students.
If you are a junior
You have one year, which is exactly enough time to go deep in one place and not nearly enough to start six things. Choose the one you would keep if the transcript did not exist, and ask what it would take to leave it measurably different than you found it.
If you are a sophomore or younger
Stop collecting. The evidence points the same way every time it is gathered: depth, not breadth. Our longer case for that is in sustained impact over activity soup.
What this does not mean
It does not mean activities can carry a weak transcript. Every dataset in this post — NACAC's survey, all nine Common Data Sets — puts grades and curriculum strength at or near the top. At Rice, extracurriculars are very important and so are GPA, rigor, class rank, essays, and recommendations. "Very important" is not a ranking. It is a floor.
It also does not mean prestige is the point. Nothing in Section C7 asks whether an activity was selective, expensive, or nationally ranked. The form asks how much weight the category carries. What fills it is up to you.
The takeaway
The 6.5% figure answers a question almost nobody is asking: across every four-year college in America, how often are activities decisive on their own? For the colleges on an actual Texas student's list, the answer is on a public form, and it is a different answer.
You can check it yourself in about ten minutes. Search for any college's name plus "Common Data Set," open the PDF, and find Section C7. It will tell you more about that college than any ranking will. For the national picture, our interactive breakdown of all sixteen NACAC factors is still the fastest way to see how the categories compare.
💛 Want a second read on your student's list before it goes out? At Lone Star Scholars we work from the data the colleges publish about themselves, not from what worked for somebody else's kid. Reach out and we will look at the list, the essays, and whether they are telling the same story.
Sources: NACAC State of College Admission (Fall 2023 survey of 185 four-year colleges); Common Data Set 2025-2026 Section C7 as published by Rice, Texas A&M, SMU, TCU, Texas Tech, UT Dallas, Baylor, the University of North Texas, and UT Austin; Common App end-of-season report, August 20, 2026; Common App announcement, July 31, 2026; Park et al., American Educational Research Journal.
Ready to Get Started?
Schedule a free consultation to discuss your student's goals and create a personalized plan.
Book Free Consultation