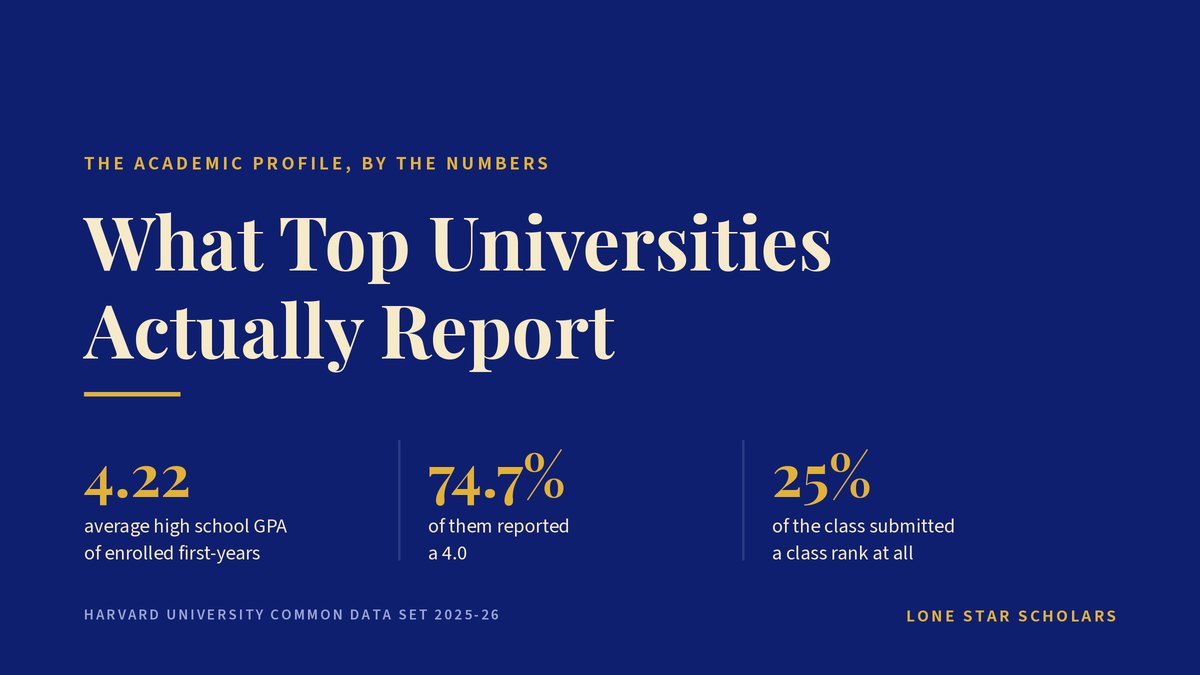
💡 TL;DR: Harvard's own Common Data Set says the average high school GPA of the students it enrolled last fall was 4.22 — a number that cannot appear on an unweighted transcript. The same form says Harvard does not consider class rank, that only a quarter of the class reported one, and that Harvard publishes no SAT composite range at all. UT Austin publishes none of these numbers. Almost every benchmark families measure themselves against has been reconstructed by somebody else, and the reconstruction is where the errors live.
Most families arrive with a version of the same question: what does a top university actually expect academically? The answers in circulation are specific and confident — a 3.9 unweighted, top 5% of the class, eight to twelve APs, a 1500. Those numbers get repeated because they sound like the kind of thing an admissions office would publish.
Colleges do publish numbers, on a standardized form called the Common Data Set. We pulled Harvard's most recent one and read it against what families are told. The form is shorter, blanker and stranger than the summaries built from it.
The GPA you are comparing against is not on your student's scale
Section C12 of Harvard's 2025-26 Common Data Set reports one figure for the class that enrolled in fall 2025: an average high school GPA of 4.22, collected from 99.1% of the class.
A 4.22 is not possible on an unweighted 4.0 scale. So whatever that average describes, it is not the unweighted GPA sitting on a Frisco ISD transcript. The Common Data Set does not ask colleges to specify whether they are reporting weighted or unweighted grades, and colleges answer with whatever their applicants sent them.
The section just above it makes the problem visible. Section C11 sorts the class into GPA bands, and the top band is "4.0" — there is no band above it. Harvard reports 74.70% of enrolled students in that top band, with another 20.38% between 3.75 and 3.99. Read carelessly, that says three-quarters of Harvard's class had a perfect unweighted record. Read against C12, it says something much duller: the buckets stop at 4.0, the average does not, and every weighted 4.4 and 5.2 in the class landed in the same box as a clean unweighted 4.0.
Two numbers from the same page of the same form are measuring different things, and neither one is the number on your student's report card. That is the honest state of the GPA benchmark. A student at 3.9 unweighted in a demanding schedule has no way to know from this data whether they are above or below the line, because the line as published does not exist.
Harvard marks class rank "Not Considered"
Section C7 asks colleges to rate sixteen factors as very important, important, considered or not considered. Harvard marks class rank as "not considered" — the same box it uses for state residency and demonstrated interest. Every academic factor it does use, including rigor of secondary school record, GPA, test scores, essays and recommendations, sits in "considered."
The often-quoted companion statistic is real but narrower than it sounds. Section C10 reports that 95% of enrolled first-years were in the top tenth of their graduating class. The same section reports that only 25% of the class submitted a class rank at all. The 95% is not a fact about the class. It is a fact about the quarter of the class that came from high schools which still rank.
For North Texas families this cuts both ways. Texas ties automatic admission at public universities to class rank, so a Texas public school student's rank exists, is calculated, and will be read. But the college weighing it hardest is not Harvard. It is UT Austin, where rank drives statutory automatic admission — set at the top 5% for summer and fall 2027 entry — and nothing else in the file substitutes for it. We worked through what that threshold does to a Frisco graduating class in Frisco ISD is hypercompetitive.
Rigor is the factor everyone discusses and nobody publishes
There is no official AP count. Not at Harvard, not anywhere. The "eight to twelve AP or IB courses" figure that circulates is an aggregation built by third parties from student-reported data, and no admissions office has ratified it. What the Common Data Set actually says about rigor is one checkbox.
What does exist is the document your high school sends with every application. Harvard's Graduate School of Education has a good primer on what a School Profile is and what belongs in it: the courses offered, how the school calculates GPA, what its graduates go on to do. Admissions offices read a transcript through that profile, which is why the only rigor question with a stable answer is a local one.
A student who took nine APs at a school offering eleven is in a different position from a student who took nine at a school offering twenty-eight. That comparison is the one being made, and it is the one a family can actually audit — pull the course catalog, list what is available in your student's strongest subjects, and see what was left on the table.
Testing: for most of this tier, the question is already settled
The test-optional framing that dominated advice from 2020 through 2024 no longer describes the schools most of these families are applying to. For the 2026-27 cycle, applicants entering in fall 2027:
- Required: Harvard, Yale, MIT, Cornell, Georgetown and UT Austin.
- Still test-optional: Northwestern and Princeton.
Princeton is the one worth reading closely, because it is changing on a published timetable. Princeton remains test-optional for this cycle and returns to requiring the SAT or ACT beginning with the 2027-28 cycle, for students entering in fall 2028. A sophomore today is in the required cohort. A senior today is not.
The local details matter more than the headline. Georgetown requires at least one full SAT or ACT and does not superscore. UT Austin requires official scores sent from the testing agency, does not superscore either, and also accepts the Classical Learning Test. Cornell superscores both exams. A student planning around a superscore at a school that does not take one has planned for the wrong test.
Where a school does require the test, "should we submit?" is no longer a strategy question. It is a deadline question.
The score ranges you have seen were assembled by somebody else
Harvard's Section C9 publishes section-level percentiles and leaves the SAT composite rows blank. What it reports is Evidence-Based Reading and Writing at 720 / 750 / 770 for the 25th, 50th and 75th percentiles, and Math at 730 / 770 / 790. The ACT composite is published: 33 / 35 / 35.
You cannot add the SAT percentiles together. A 1450 "25th percentile composite" assumes the same students sat at the 25th percentile in both sections, which is not how percentiles work. Every tidy "1450 to 1560" band you have read for Harvard was produced by doing exactly that.
The reporting gap is wider closer to home. UT Austin publishes its Common Data Set like everyone else, and in the 2024-25 edition sections C9 through C12 are entirely empty — no score percentiles, no GPA distribution, no class rank breakdown. The largest destination for North Texas applicants reports none of the numbers families are told to benchmark against, while requiring the test it declines to describe.
Activities: depth over volume, and we have made this case already
Nothing in this post changes what we have written about extracurriculars, so we will not relitigate it here. The short version is that the categories colleges rate on the same form tell a more useful story than any national average, which we worked through in what colleges actually do with your activities list, and the case for depth over breadth is in sustained impact over activity soup. Our interactive breakdown of all sixteen admission factors compares the categories side by side.
What to audit this month
- Find out which GPA your student's colleges will see. Ask the counselor which figure goes on the transcript and the School Profile — weighted, unweighted, or both. You cannot compare against a published average until you know which scale you are on.
- Pull the course catalog, not the AP count. List every AP, IB or dual-credit option in your student's two strongest subjects. Rigor is judged against that list, not a national number.
- Check the testing policy for every school on the list, on the school's own site. Requirement, superscore policy, and whether official scores must come from the agency. Three of the six required schools above differ on the last two.
- Read one Common Data Set end to end. Pick the college at the top of your student's list, search its name plus "Common Data Set," and open Section C7 and Sections C9 through C12. Ten minutes there will tell you more than a month of forum threads.
The bottom line
The academic profile these schools expect is real, and it is demanding: a transcript that took the hardest available path and held up under it, scores that clear the bar at the growing number of schools that require them, and a few commitments pursued long enough to have left a mark. None of that is in dispute.
What is in dispute is the precision. The specific thresholds families are handed — the 3.9, the top 5%, the eight-to-twelve, the 1450 — are reconstructions, and the colleges themselves publish less, and less consistently, than the summaries suggest. Planning against a number that no admissions office ever published is how a strong student ends up optimizing for the wrong thing.
💛 Not sure which of these numbers actually applies to your student? At Lone Star Scholars in Frisco we start from what the colleges on your student's list publish about themselves, then work backwards to what is still changeable in the time remaining. Reach out and we will read the transcript, the course catalog and the list together. Students looking for the kind of documented academic work that holds up in a file can also join the interest list for our 2027 Summer Research Program.
Sources: Harvard University Common Data Set 2025-2026, Sections C7, C9, C10, C11 and C12; University of Texas at Austin Common Data Set 2024-2025, Sections C9 through C12; published standardized testing policies of Harvard College, Yale, MIT, Cornell, Georgetown, UT Austin, Northwestern and Princeton, retrieved September 30, 2026; Harvard Graduate School of Education, Making Caring Common, on school profiles.
Ready to Get Started?
Schedule a free consultation to discuss your student's goals and create a personalized plan.
Book Free Consultation